PUZZLE DESIGN ANALYSIS
We need to gather accurate data so we can analyze and find out where possible errors or modifications could be made.
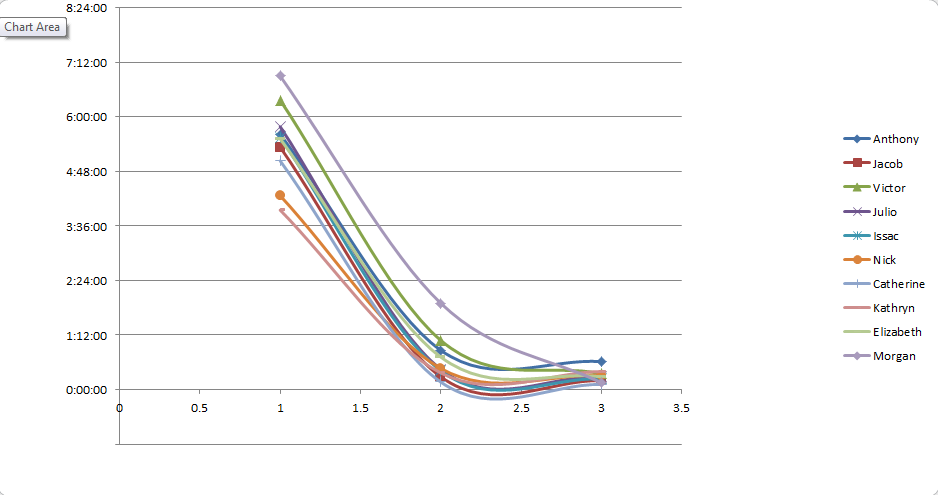
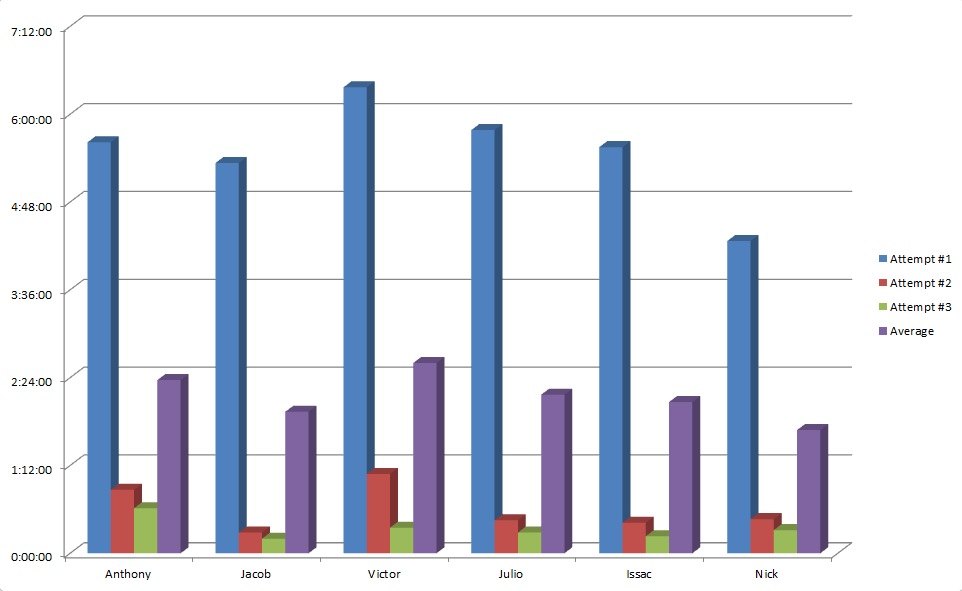
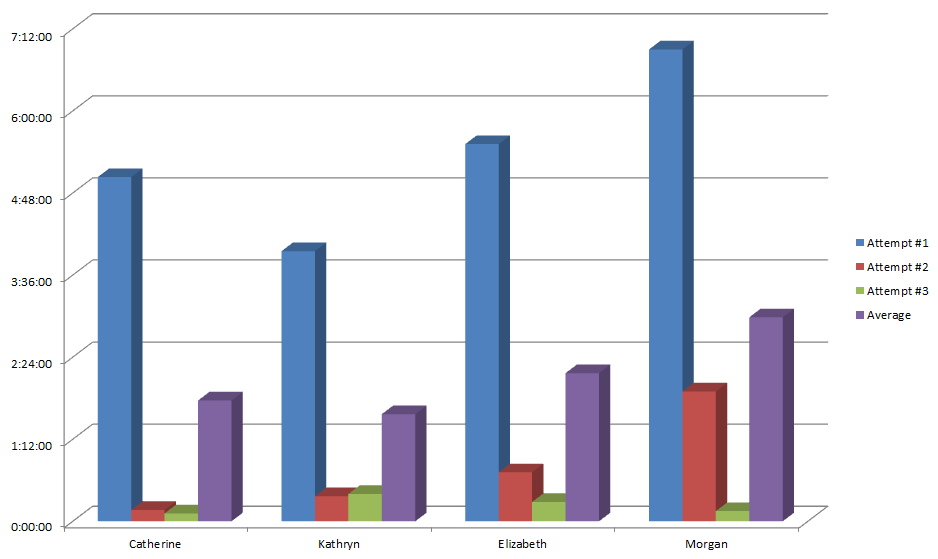
The graph shows the trends between the different attempts. According to this graph, the time elapsed during each attempt decreases greatly with each proceeding attempt.
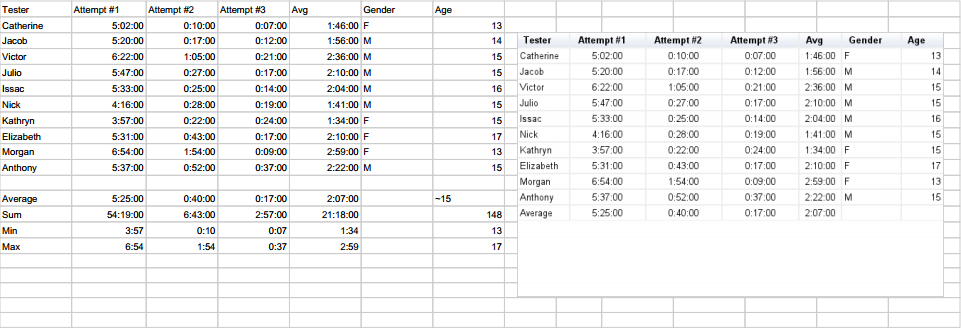
The mean of the data, taking into consideration all 3 attempts of all age groups and genders, was 2:07.
The median of all of average data is 2:04, and there was no mode as there was no repeats of time values. The range of all average data was 1:25.
The median of all of average data is 2:04, and there was no mode as there was no repeats of time values. The range of all average data was 1:25.
|
Average Attempt #1: 5:25
Average Attempt #2: 0:40 Average Attempt #3: 0:17 |
In conclusion, this analytic data shows few, if any trends, in solve time in regards to age or gender. There was a very apparent trend in the decrease in duration in attempts.
|
